A few years ago, a colleague of mine shared a paper with me about a new method of visualizing elevation data using slope gradient and convexities/concavities, called a Red Relief Image Model. I was initially skeptical – as far as I could tell, the visualization wasn’t all that different from a multi-directional hillshade with a sloped color gradient overlay. I contacted Tom Patterson, a former National Park Service cartograhper, to hear his take, and while he was unfamiliar with the term, he, too, felt much of the map could be imitated through hillshade and overlays.
Since then, Red Relief Image Maps (RRIM) have hit the mainstream – showcased by ESRI, as well as appearing as a built-in tool for Quick Terrain Modeler. And since then, I’ve come to appreciate the striking aesthetic quality these maps provide, especially for areas not just of high relief, but of somewhat alien environments.
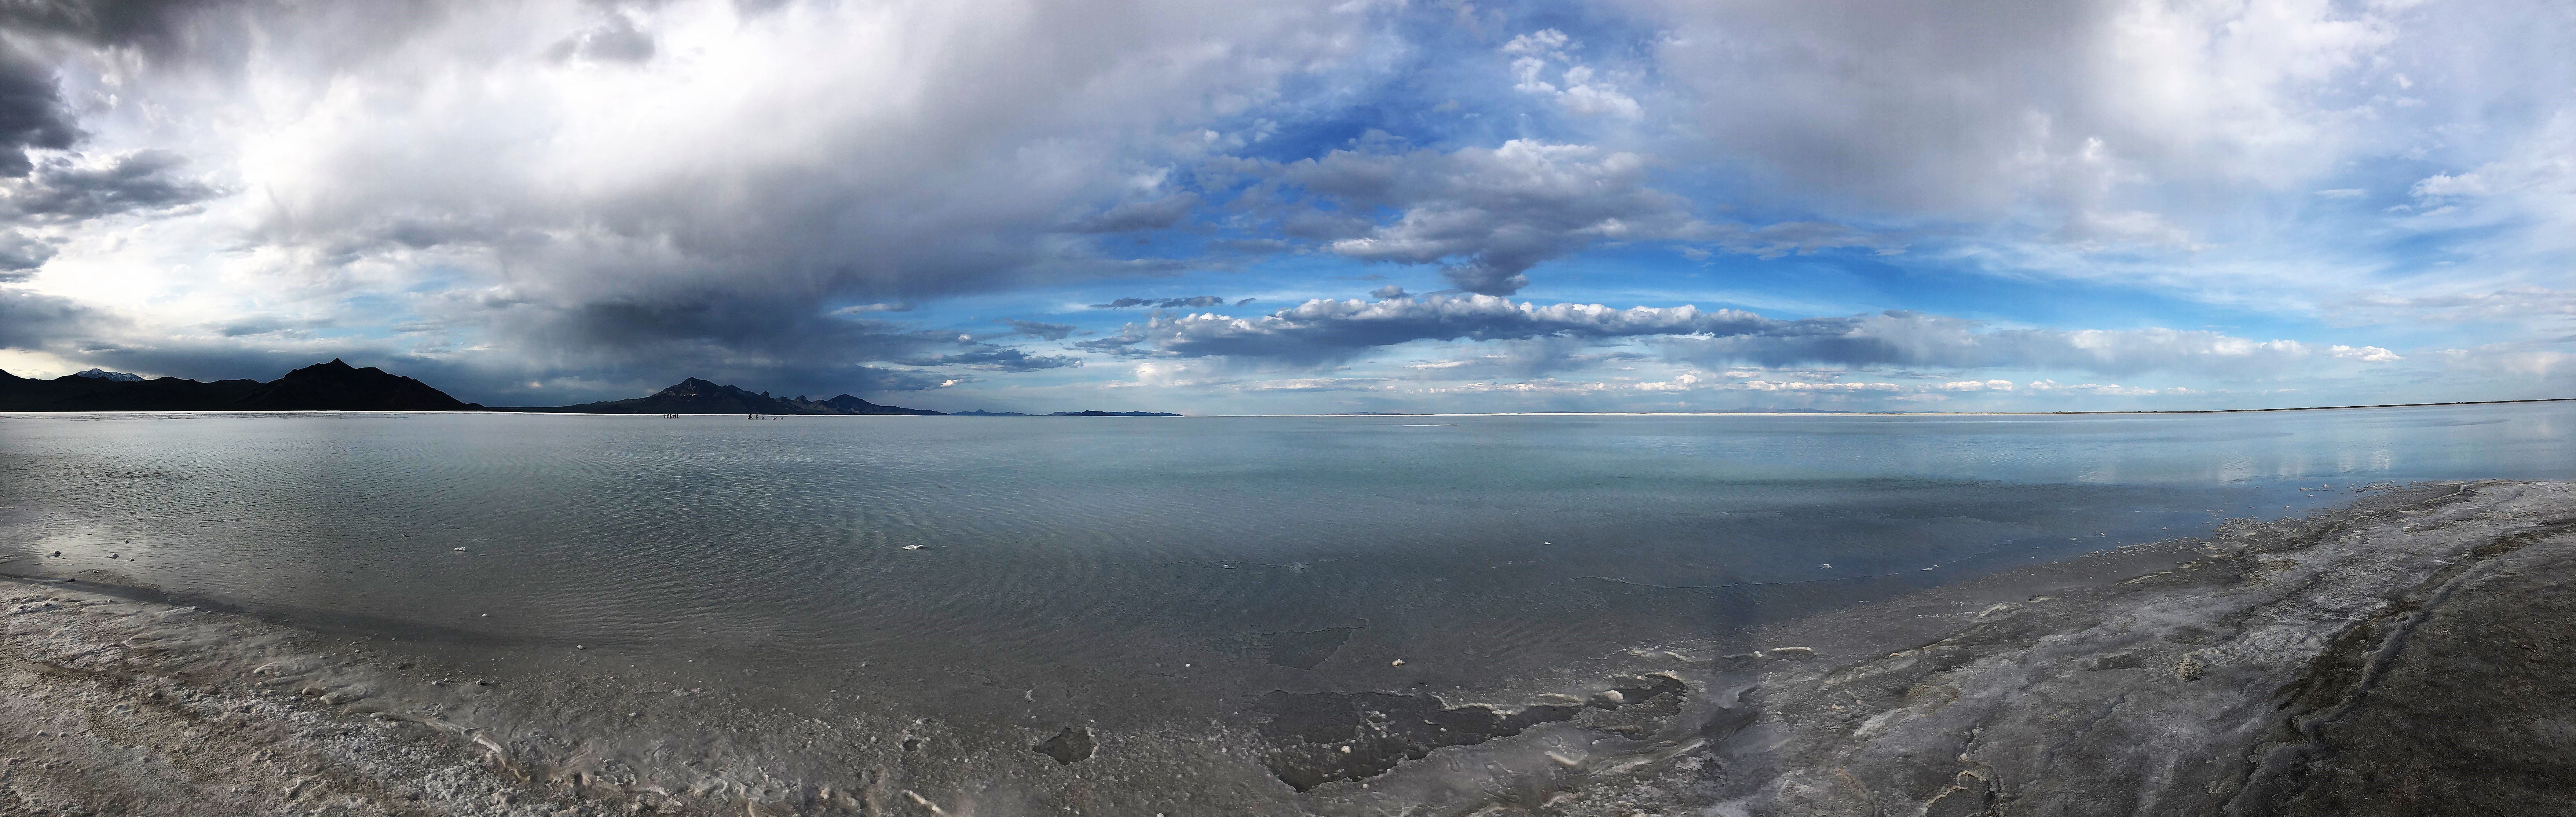
Take, for example, the desert. I spent a week in May on the Utah/Nevada border, assisting with an Interagency Wildland Fire UAS operational training, for this summer’s fire season call-when-needed UAS contract. The UAS were all large – 100 lbs or greater – and fly upwards of 10,000′, so the testing was conducted on remote BLM lands in restricted airspace, one ridgeline over from the Bonneville Flats.
The salt flats of the area are residual from the ancient salt lake, and as the lake evaporated over thousands of years, the sediment deposits at the high water marks left contoured bathtub rings along the sides of the mountains in the area, which are quite visible when looking at the hillsides from the flats. But nowhere are these marks more evident than in a mock Red Relief Image.
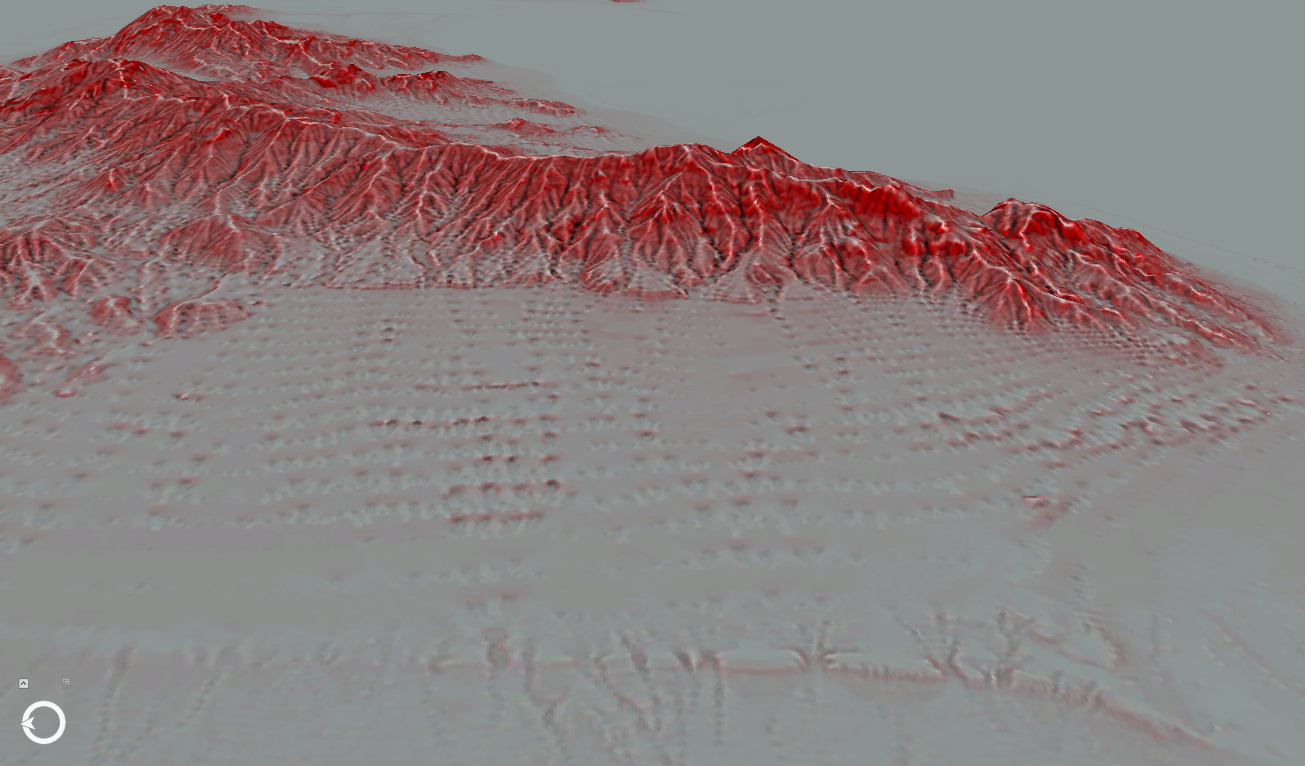
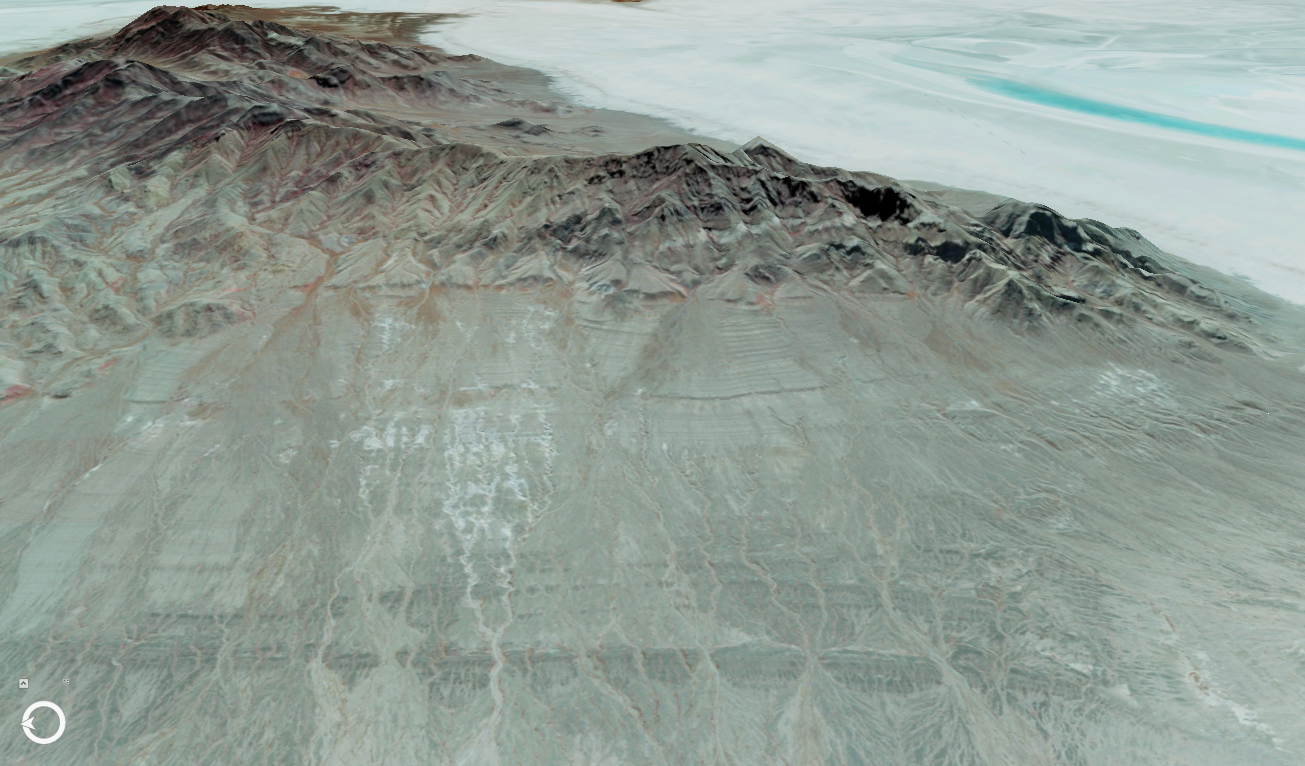
The red makes the waterlines pop more than just the multidirectional hillshade, or just the Color Infrared NAIP imagery alone. And when I drape the red slopes over the CIR NAIP imagery, the geology and hydrography of the area are striking.

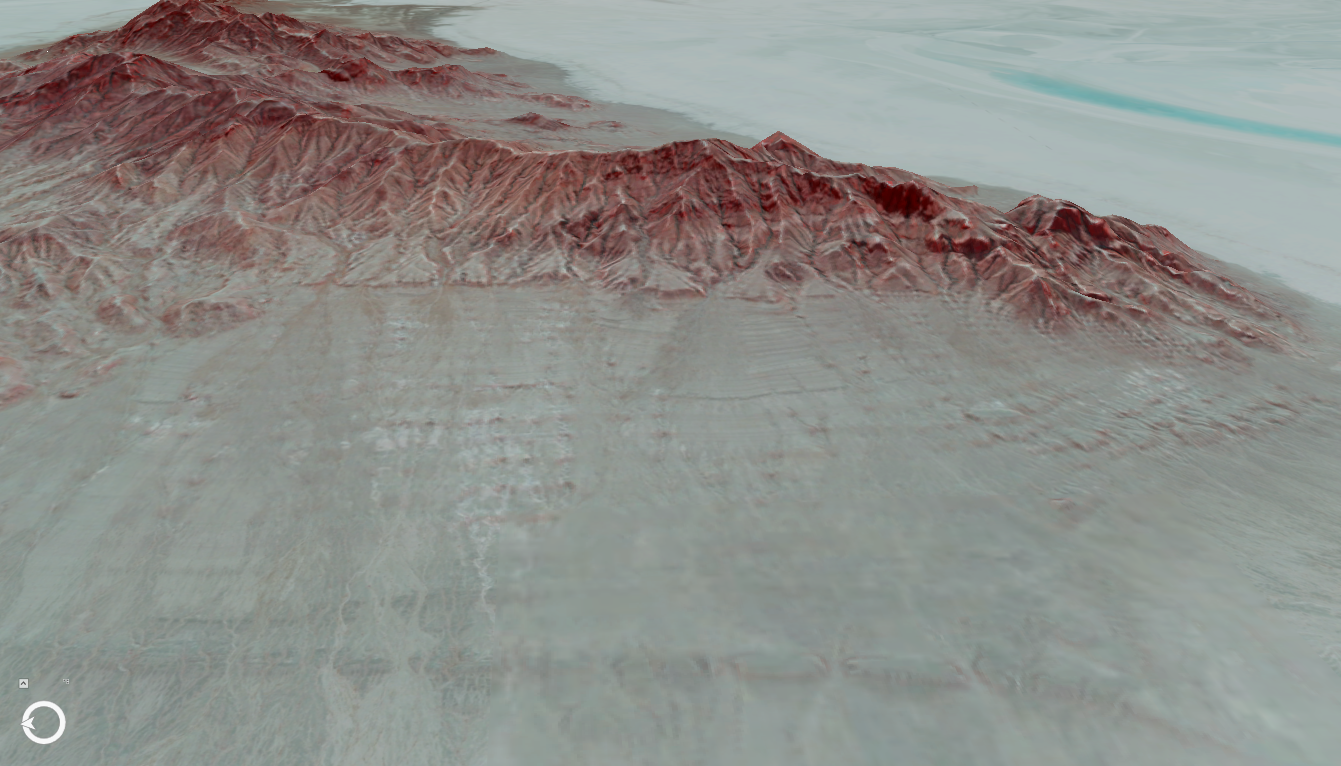
Admittedly, although the the image looks similar to the maps created using the true RRIM methods, I only used open source software to create the overlays, only slightly modifying the methods outlined here. And instead of using LIDAR, I used a 10 meter DEM. Although the RRIM methods were developed with LIDAR in mind, I find that the value added to coarser datasets is more helpful, where small details can get lost in the noise.
Although I was initially skeptical about the hype, I do see some cartographic benefits from the displays, and at some point plan to try my hand at mapping part of the Alaska Range. Until then, enjoy this 3D fly through of the Bonneville Flats area.

You must be logged in to post a comment.