Put-In
Earlier this summer, as a group of us planned to float the Nenana River after work one day, we discussed where to put in our boats. Sam suggested the Grassy Knoll and John, chuckling, replied, “Where do you mean when you say the ‘Grassy Knoll’?” With the ensuing discussion in the back of my mind as we floated that evening, I silently began formulating the idea of a Nenana River place names map.
Later in the season, the Fairbanks Paddlers group listserv had an email that also led to some confusion on place names, but as fate would have it, the illustrious John Schauer stepped in to clear up matters and offered up a geospatial file of place names for the river. I pounced on his offer and added his dataset to my growing collection of GPS tracks and waypoints.
By the end of the season, the cartographic design was coming together conceptually and I ran it by some friends as we floated past the Reindeer Hills. Shannon, a former river guide, told me of more local place names. She also pointed me in the direction of another Nenana River map: Russell Lyman’s beautifully hand drawn map. There are few things I love more than hand-drawn shaded relief, and if you are a lover of maps, then I highly recommend purchasing a copy. But for the purposes of my orientation needs, Russell’s map didn’t quite cover my area of interest, nor did it focus solely on the needs of a paddlecraft audience. Shannon also put me in touch with Bill “Buckwheat” Overington, a long time Nenana River whitewater guide and outfitting business owner, who tripled my place name count.
After I hung up my drysuit for the season, I snuggled down for the winter and dove head first into creating my very own Nenana River paddlecraft map. My goal was to create a map to document the lingua franca of both terra firma and aqua corpus for the paddlers that frequent this area.
This map is brought to you by the adventurers who came before my time and the friends who take the time to share theirs1. Specifically, Bill Overington, John Schauer, and Sam Hooper contributed to this map greatly in providing information and reviewing (all mistakes are mine). Each paddles various watercraft, but can identify the most as a rafter, a kayaker, and a packrafter, respectively.
Read on for the cartographic nitty-gritty.
Headwaters
Conceptually, I knew I wanted the map to be something in a blue tint, either an original positive for blueprints (blue lines with white background) or the blueprint reproduction (white lines on a blue background), though I didn’t want to go the Full Huffman in monochrome. In addition to Daniel’s monochrome style, I had also been eyeing his cyanotype maps – if not the manufacturing process, then at least the aesthetic.
I also wanted a slightly old-timey vibe to counteract the standardization of my day job and I already had a few maps in mind that I had seen while perusing the Library of Congress, UAF, David Rumsey’s, and NOAA online map collection (cyanotype fades when exposed to UV rays).
Finally, I recalled seeing a blueprint-style map by Warren Davison and knew I wanted to “steal” some of the cartographic styles he made publicly available through his ArcGIS Pro package and style.
Rolling with the Geospatial Surfacewater Framework🎵
One of the real struggles of GIS in Alaska is the National Hydrography Dataset (soon to be replaced with 3DHP). For many years, our state remained unmapped, or grossly mapped, compared to the available technology. It was a running joke in the early aughts that if you checked out a layer for editing from the NHD Update Tool and checked it back in without making any edits, the dataset would be rejected due to topological errors. This is due to the lack of digital geospatial data available for Alaska thanks to the size, remoteness, and environment of the state (thus, my goal to put Alaska on the map.)
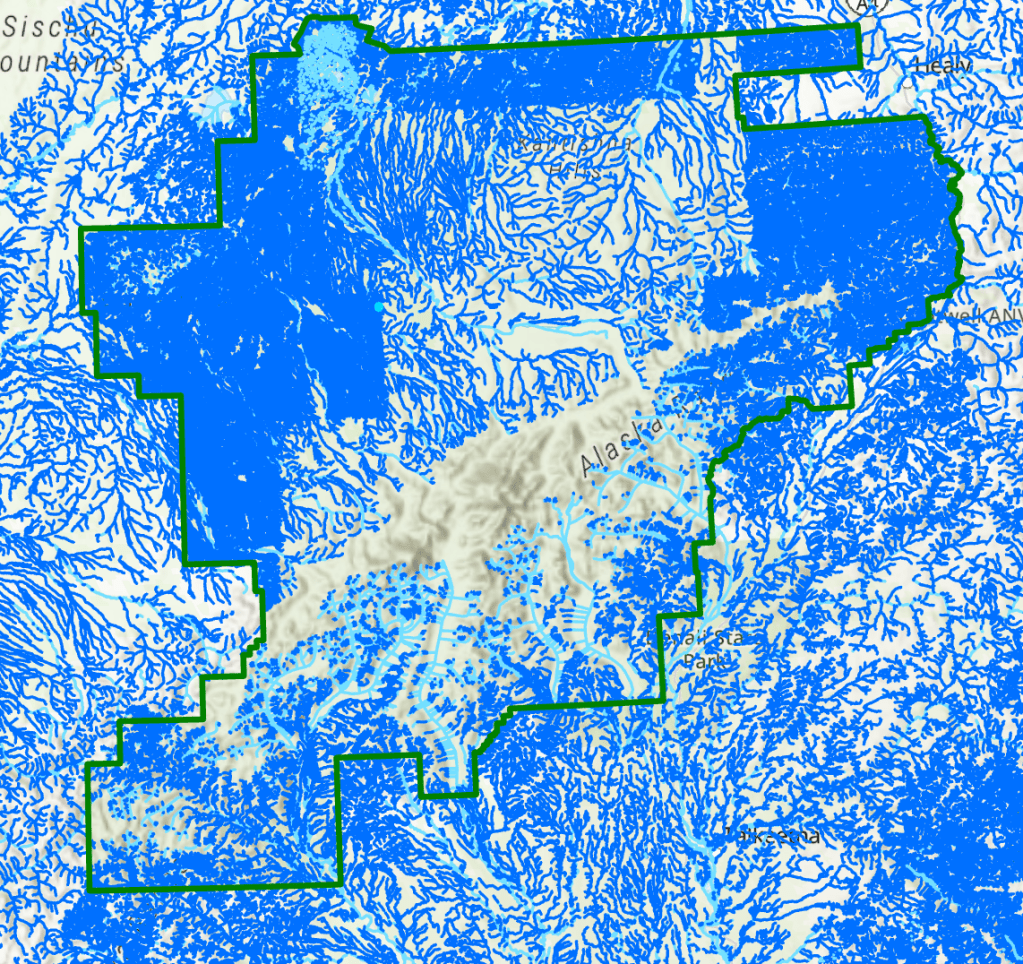
Since the start of the Statewide Digital Mapping Initiative in 2008 (where generating high resolution orthoimages and elevation models were a priority that wasn’t accomplished statewide until 2021!), there has been a concerted effort among various agencies and institutions to create elevation-derived high resolution (1:24K) hydrographic feature datasets that provide the same feature attribution as that provided to the lower 48. This effort is ongoing and is expected to be finished by 2030. Each region is being tackled separately, by different entities, and in my HUC of interest, although there have been some corrections to the oldest datasets, the value-added attribution from NHDPlus HR is still unavailable.
Another one of my hopes was dashed when looking for data to make flow maps: there is no existing, long-term river gauge on the Nenana from which to draw statistics on discharge or break-up/freeze-up dates. Although one gauge has existed at the Healy Bridge since the 90’s, it collected data intermittently and was retired in 2007.
All of these challenges combined make it difficult to conduct analysis such as elevation-derived Strahler’s Order or generate an accurate flow map (although I’ve seen some Alaska maps with Strahler’s Order, at a statewide extent, these are more for cartographic design).
While I wish I could create visually appealing maps based on a theme of water volume or height, I decided to stick with the hydrography datasets available to me and create a map showing a more geographically accurate depiction of the area of the Nenana River and general area of streams as lines – at least until 2030.
Flowlines
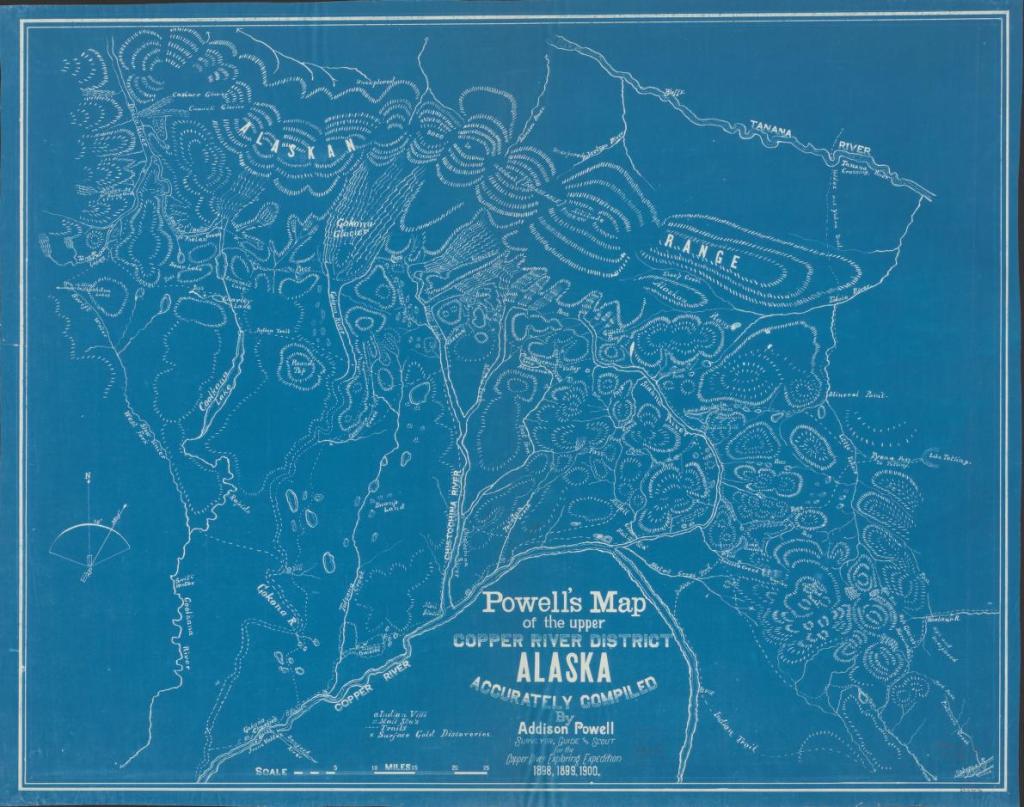
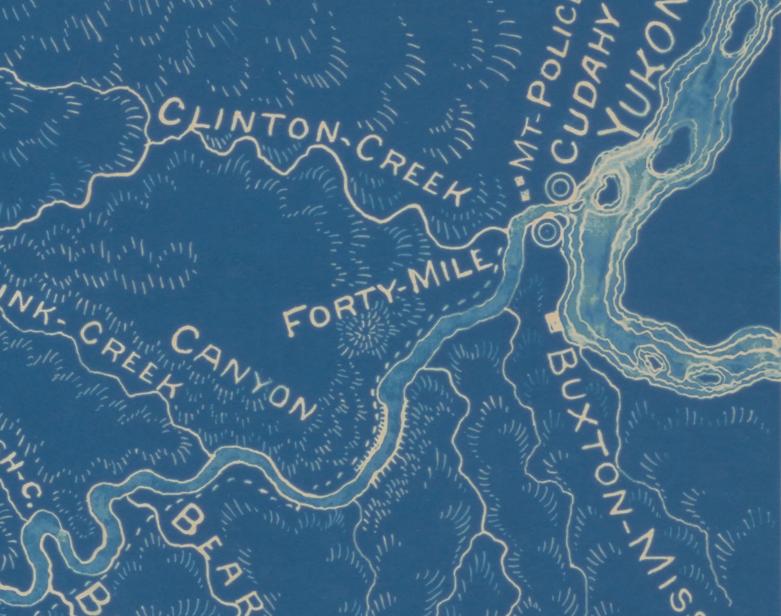
Although I like the ink-stamp style for water polygon fills created by Warren, given that I couldn’t enlarge the Nenana without sacrificing other details, I really needed a way to make the Nenana pop off the page without adding modern symbology. I wanted to emulate the outline with a slight inner watercolor style of an 1899 map of the Fortymile Country (a map which, coincidentally, I found when planning another float trip with Shannon).
I needed to create a route for an elevation profile as well as for a route event layer, which required dissolving the Nenana River separate from the other streams in the NHD. I added a Buffer symbol effect to the Nenana River to exaggerate the area, though was disappointed to discover that layer masking does not apply to symbol effects, taking me back to the tried and true Buffer tool to generate the polygon mask.
I also dissolved the streams by their GNIS Name, though this required a bit of manual attribute editing, since some of the most well-known streams lacked names (technically, Iceworm Gulch is not the name of the stream itself, but whatever – my map, my place names). I then applied a Taper symbol effect to the streams and voila – a poor Alaskan’s Strahler’s order.
Hachures
As I was imagining my old-timey, blue monochrome-ish map, I also intuitively knew I would need some hachures for elevation depiction. Shaded relief is too modern and contour lines interfered with the waterflow lines. I also knew that whatever style of elevation I went with, the model had to match the flowlines – if you have ever used the 60-meter NED of Alaska with the ifSAR-derived NHD or the older NHD data with the ifSAR elevation (or the ArcticDEM Mosaic), you will inevitably find yourself with streams running uphill.
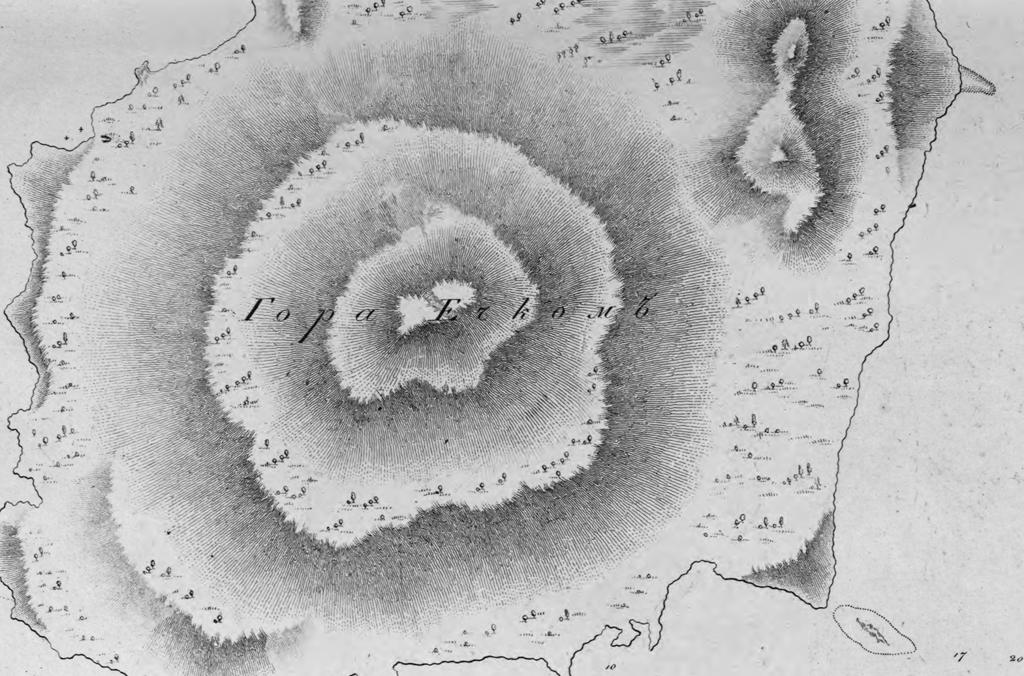
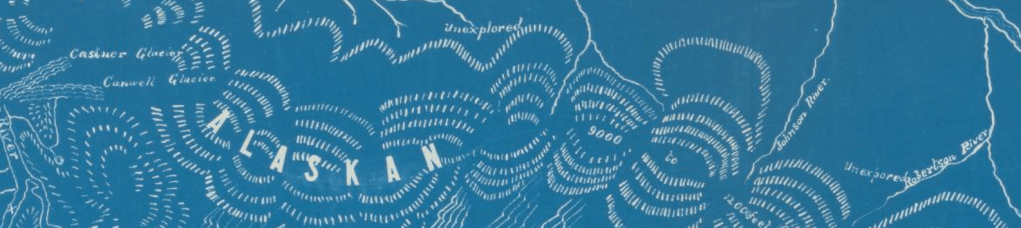
Late 18th century maps produced by the royally-sponsored Russians and the British included hachures that cartographers had time to “hach out” with pencils (hashtag mapjokes). But in all the examples of Alaska cyanotype survey maps (usually hastily done in the field by an enterprising soul ), the vast majority of the elevation is only depicted around the waterways and the highest peaks without much weighting for aspect and slope.
There are as many ways to make hachures as there are to say hachure; I dabbled in Kenneth Field’s Terrain Tools, John Nelson’s freewheeling method, and Warren Davison’s hachure quest. Warren’s techniques were amazing, but for the purposes of this map, I only went with a few of the attribute-driven bells and whistles he provided.
Features
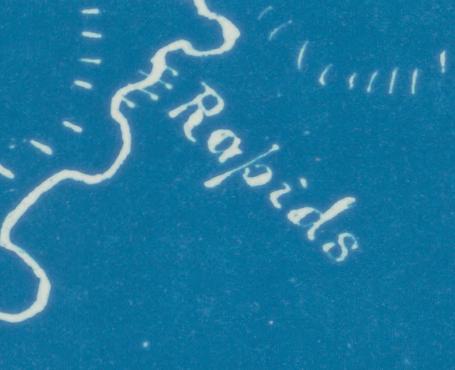
Although I know my friends and I won’t be pulling this map out on the river as we approach the next wave train, I wanted the map to document local place names for two main types of features: Rapids and Access Points.
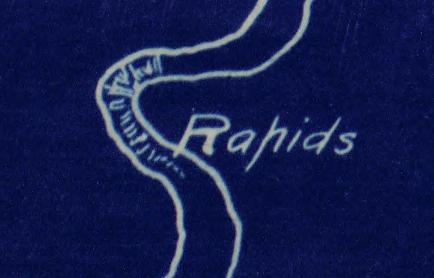
For the rapids, I wanted to indicate the class by both size and number of wave symbols, similar to the historic maps. I drew a wave symbol using my favorite vector graphics software and imported as a picture marker. I also symbolized by both class and scale range to differ the displays in the main map frame and the inset map frame. Using the route event layer that I had generated from the rapids on the Nenana, I rotated the rapid symbol based on the angle attribute.
Labels
Each of the example cyanotypes for Alaska had a slightly different font, but there were two clear themes: A handwritten serif font and a sans-serif font for small areas. I used Warren Davison’s Old Ink Font for the place names, and used a cleaner Architect font for the creeks and transportation. I also wanted to the edges to be a bit blurry, as if the ink had bled a bit.
When I initially created the map, I experimented heavily with scales, queries, and custom expressions to meet my goal of using one map and minimizing feature classes: I used scale-based sizing for the label text (e.g., different sized fonts for the inset and main map frames to match visually); label classes for the various features (e.g., white Old Ink font for water features and blue Architect font for transportation features); label visibility scale range (e.g., to only display the canyon inset labels at a larger scale); Arcade expressions for handling different styles of text for a given feature (e.g., a superscript “t” for Mt. Healy or attribute-driven font size based on rapid Class type); varied symbology by attribute (e.g., angle rotation of rapids and symbol size based on rapid class); scale-based symbol sizing (e.g., the community point feature size matches in both map frames); feature display filter based on scale (e.g., to only display canyon inset features in the canyon inset), and of course, SQL queries for the label classes and feature classes (e.g., to only show rapids). Throughout all of this, I realized I may have been able to meet most of these tasks through almost only Arcade expressions.
In spite of all these knobs and levers, I knew I wouldn’t be satisfied without annotation. Turns out, unfortunately, that Pro does have some limitations in creating standard annotation when relying on label and feature scales:
Label class scale ranges are respected. When the tool generates annotation for a specific map scale, it will only convert label classes that are turned on and visible at that scale.
– Esri Help Documentation
Because I had already formatted my map based on a reference scale to generate the annotation, I removed the feature display filter, the scale based sizing, and the label visibility scale, made a few tweaks to the label class queries, and then reapplied the display filter and visibility scales again afterwards. Thankfully, because I had a solid colored base map, I didn’t need to weigh down the map with masked annotation but was able to rely on a text halo instead.
Take-out
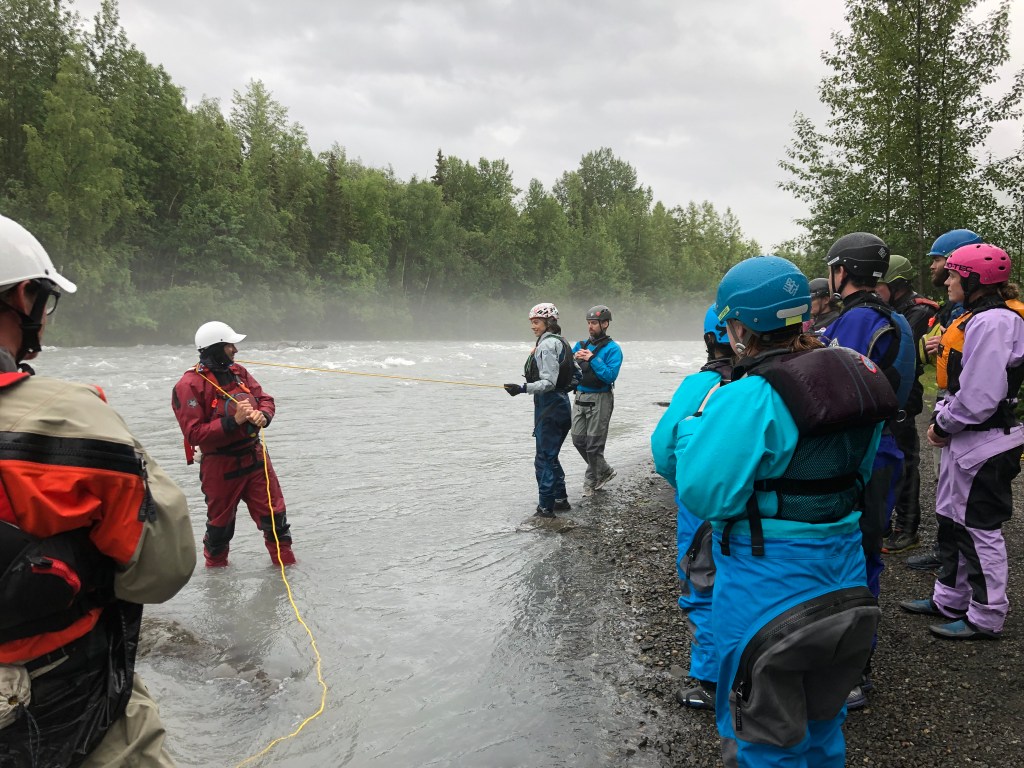
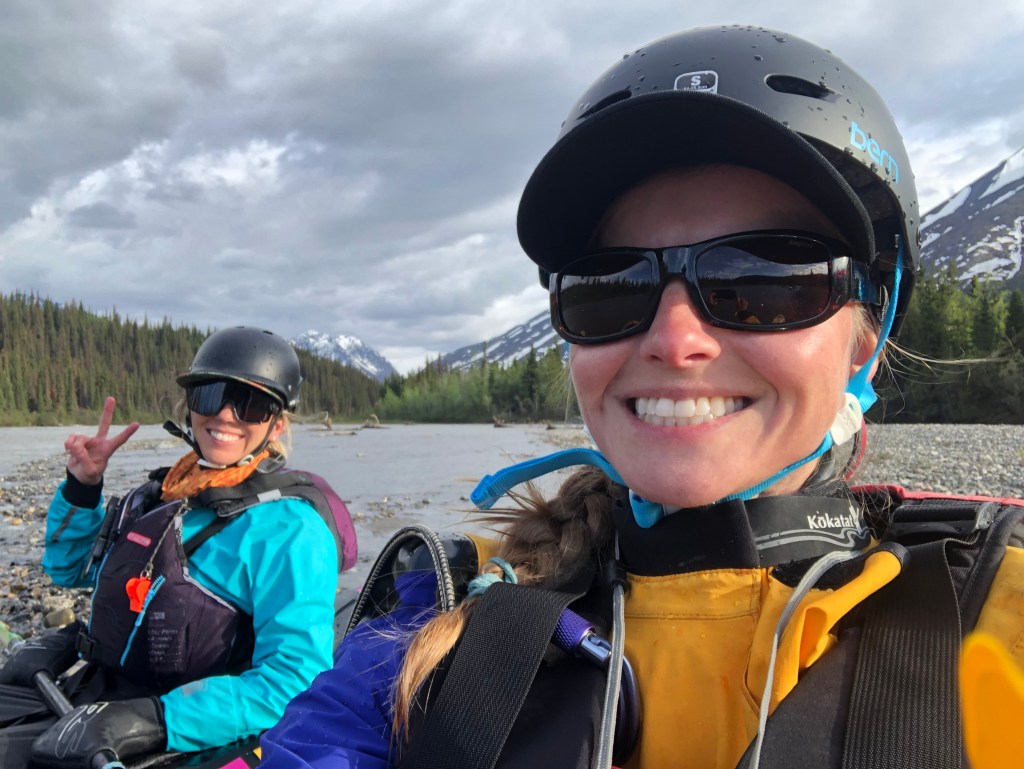
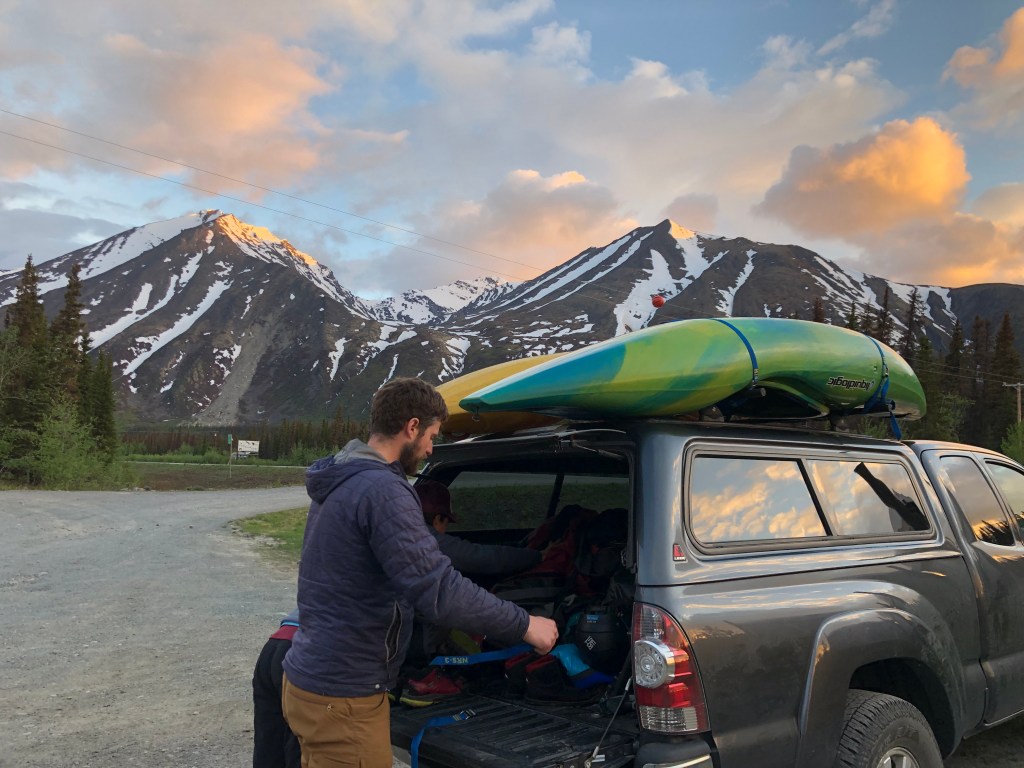
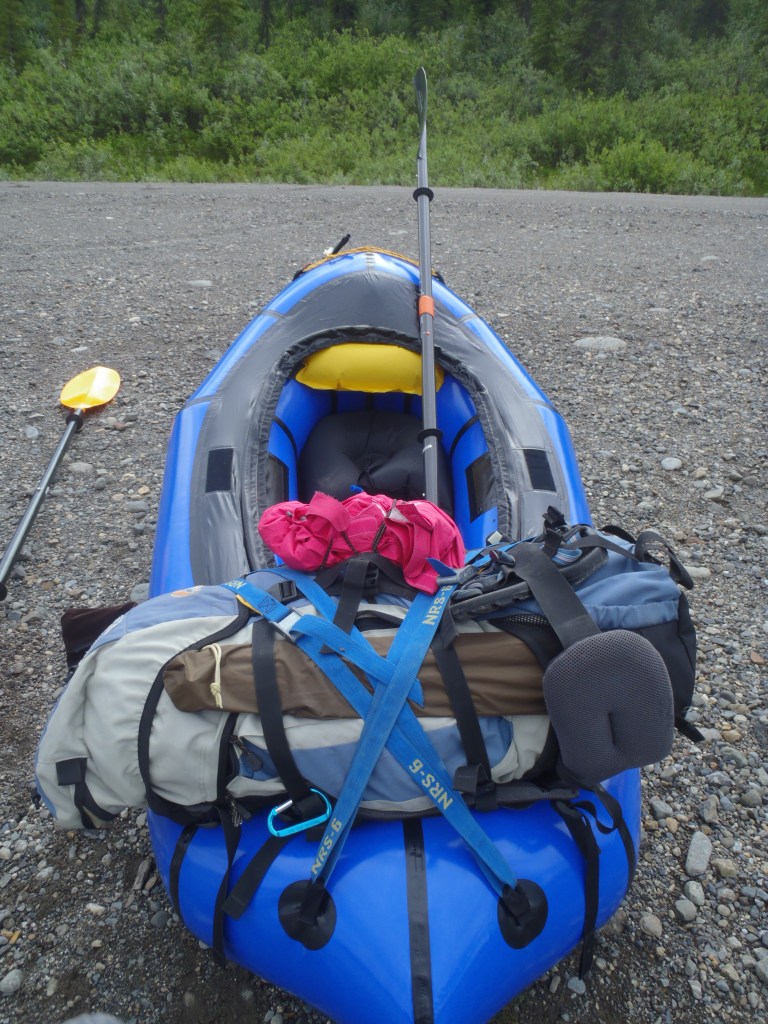
Last winter, I upgraded to a cargo fly packraft with thigh-straps and read Luc Mehl’s new book “The Packraft Handbook“, so I was much more motivated to get out on the water this past summer. I also finally took one of Luc’s swiftwater classes, which now includes a dialed down option for recreational paddlers. I strongly feel that all of these things have made me a safer paddler. It also makes me consider dabbling in hardshell river kayaking….
Since 2014, I’ve been able to link together floats along the entirety of this Nenana River map, except for the section from Riley Creek to Kingfisher Creek, which is the portion containing Terror Corner. As I’ve been slowly building my skill and confidence over the past ten years, Terror Corner sounds a lot less terrifying. And maybe someday I’ll run the Canyon under my own paddle power.
I’m already looking forward to learning more in the summer of 2024!
- This map is also brought to you by Esri’s ArcGIS for Personal Use License. This product is prohibited from commercial use. ↩︎

You must be logged in to post a comment.